An enterprise-grade analytics portal—branded for your business, priced for your team.
Centralize dashboards, data dictionaries, taxonomies, benchmarks, business resources, and QA workflows in one white-label workspace—without the cost or complexity of a custom agency-built platform.
Works with the BI tools you already use. No dashboard migration required.
Referenced definitions
- ClicksApproved
- Cost per ClickApproved
- ImpressionsApproved
Referenced benchmarks
Industry median 3.1:1 · top quartile 5:1
Your dashboards already exist. The context around them doesn’t.
Definitions live in spreadsheets, targets live in presentations, dashboard links get buried in Slack, and the person who knows why a metric looks different isn’t always available. KPI Compass brings all of that context into one governed analytics portal.
Tableau

Power BI

Looker

Datorama
One governed portal for your whole analytics practice.
Centralize dashboards
Organize dashboards from Tableau, Power BI, Looker, and other BI tools by team, client, business unit, or subject.
Add governed context
Owner · Jordan Blake
Place approved definitions, formulas, owners, sources, qualifications, and related terminology alongside each dashboard.
Explain performance
Company target · 4:1
Industry median 3.1:1 · top quartile 5:1
Connect company targets and sourced industry benchmarks to the metrics people are viewing.
Make analytics conversational
Ask what a metric means, where to find a dashboard, who owns it, or how definitions differ across platforms.
Build decision-ready reports
Generate audience-specific insight reports from selected dashboards, sources, metrics, and context — then export to PowerPoint or PDF.
Works with your existing stack
KPI Compass doesn’t replace your BI platform or semantic layer. It creates the organized, governed experience around them — no dashboard migration required.
Build organizational knowledge automatically.
Every validated report expands your organization’s shared understanding — captured as you work, then searchable and connected.
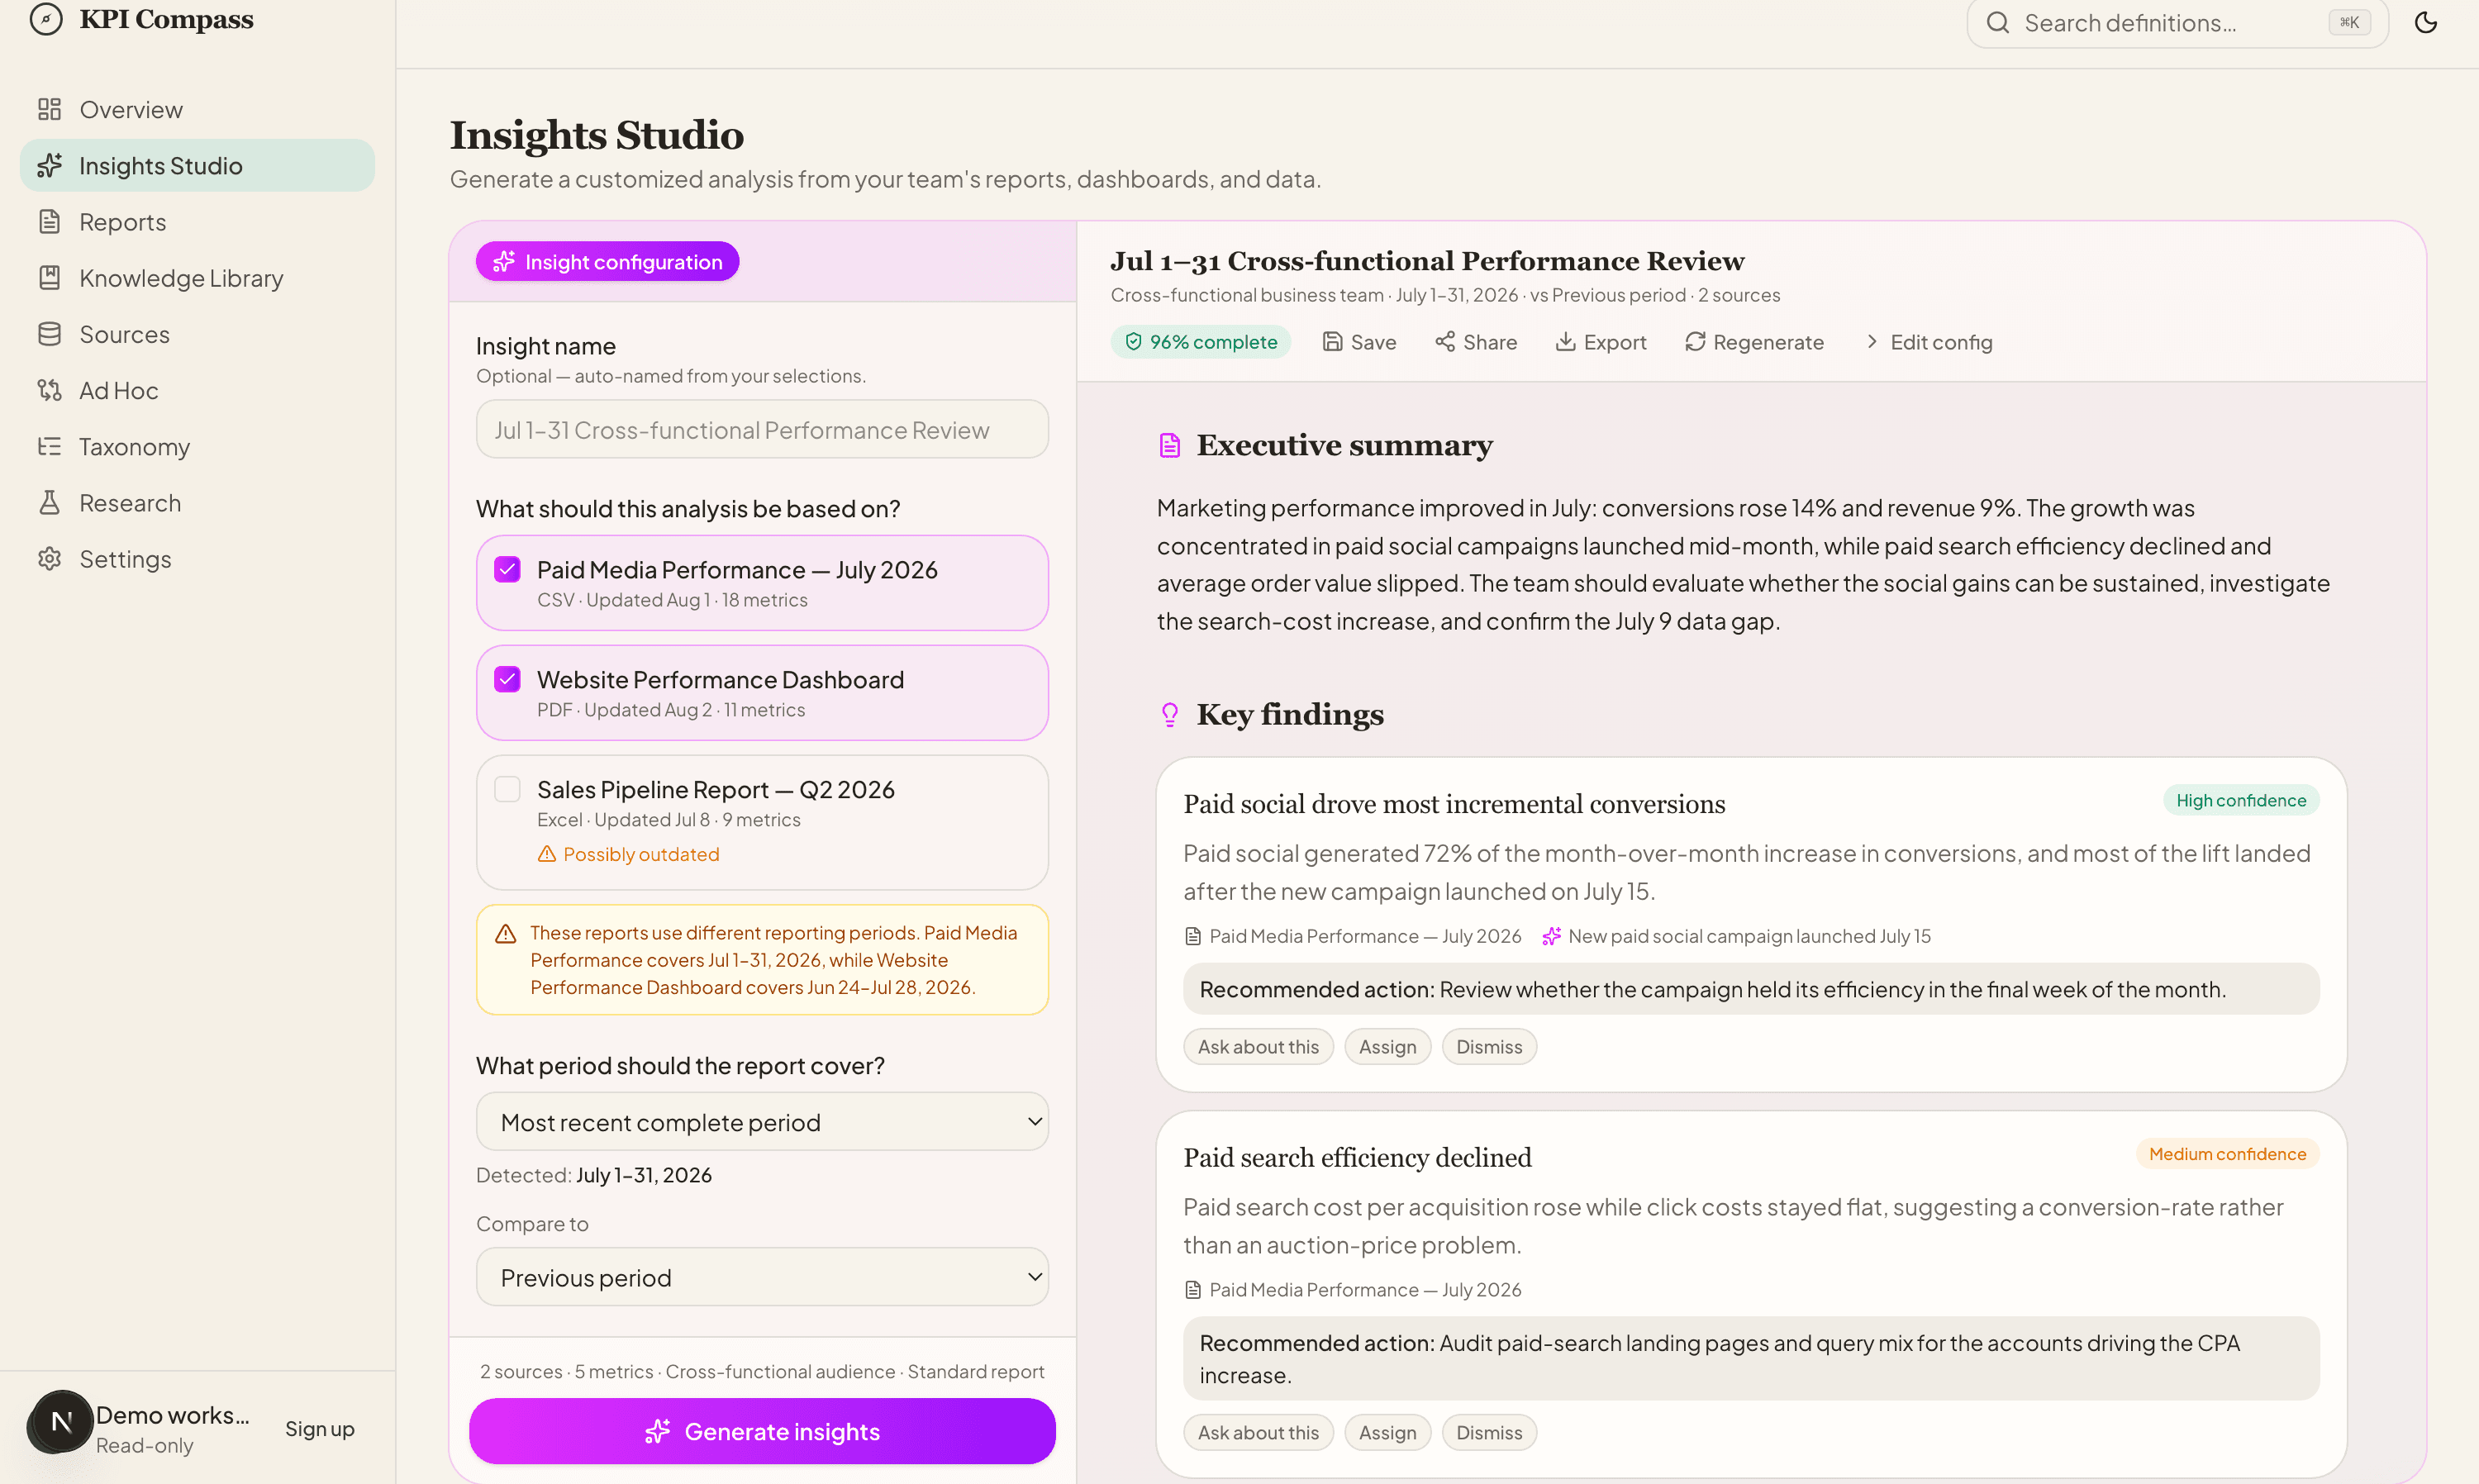
Turn reports into a decision-ready brief.
Select your reports, the metrics that matter, the audience, and the business context. KPI Compass generates a structured insight report — findings, evidence, and recommended actions — that you refine through chat.
Built for business teams.
Designed for the people responsible for producing, reviewing, and sharing business reporting — not just the teams maintaining data infrastructure.
Integrates with your existing stack.








Works alongside your existing analytics investments.
Why KPI Compass is different.
- Trust dashboards blindlyValidate every report
- Static documentationLiving Knowledge Library
- Manual QAAutomated validation
- Definitions scattered across docsCentral source of business knowledge
- AI guesses business terminologyAI uses validated organizational context
Questions, answered.
- Is this a semantic layer?
- No. A semantic layer defines how metrics are computed; KPI Compass validates that the numbers in your reports actually match your trusted sources, and turns them into governed knowledge. It sits above your semantic layer, not in place of it.
- Does KPI Compass replace Tableau?
- No — it works alongside it. Tableau builds dashboards; KPI Compass validates the numbers those dashboards and reports show. Upload Tableau workbooks (.twb/.twbx) and calculated-field formulas are parsed exactly from the XML.
- Can I connect Snowflake?
- Yes. Connect Snowflake, BigQuery, Databricks, Redshift, Postgres, and more as trusted sources, then validate reported numbers directly against them.
- Can AI answer questions using our company terminology?
- Yes. The AI Consultant answers from your validated reports, certified definitions, and trusted sources — with citations — so it uses your organization's context, not generic internet knowledge.
- How are discrepancies detected?
- You map a reported metric to a source value and a tolerance. Accuracy checks compare the two, flag anything outside tolerance as a discrepancy, and explain the difference with a suggested resolution.
- Can I validate Power BI dashboards?
- Yes. Bring in exports and reports from Power BI, Looker, and other BI tools, then validate the metrics they present against your trusted sources.
- Does this replace a data catalog?
- It complements one. A catalog documents where data lives; KPI Compass builds a living Knowledge Library of validated metrics, terms, and reports — governance that grows from the reporting work your teams already do.
The confidence layer for modern analytics teams.
Build trust in every report, every metric, and every business decision.